
Series
You can find Series in Sets> Sequence section of the tools. It’s located under Range and Similar tools are Random, Fibonacci and Sequence. This tutorial is about how series can help you produce parametric geometry.first of all, you can easily search “SER”, to find the series.
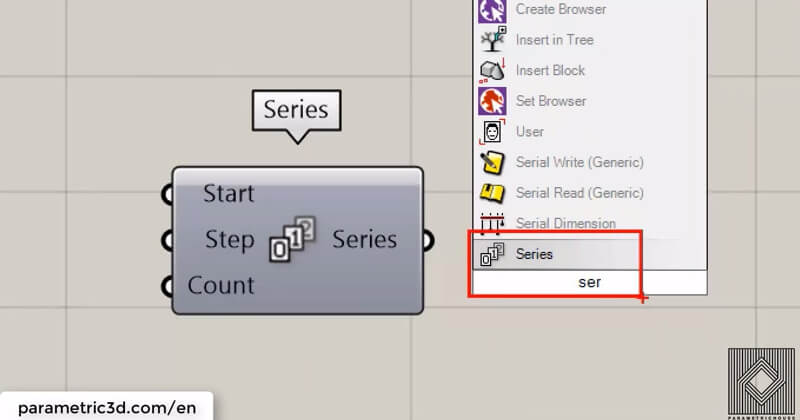
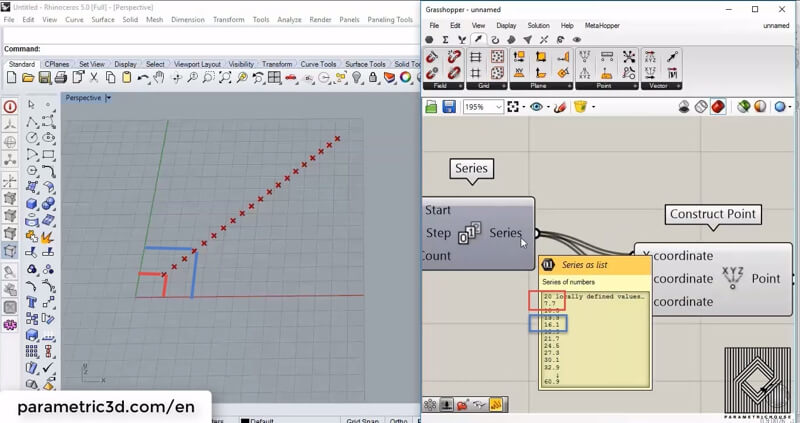
The first input is “Start” and defines the starting number.
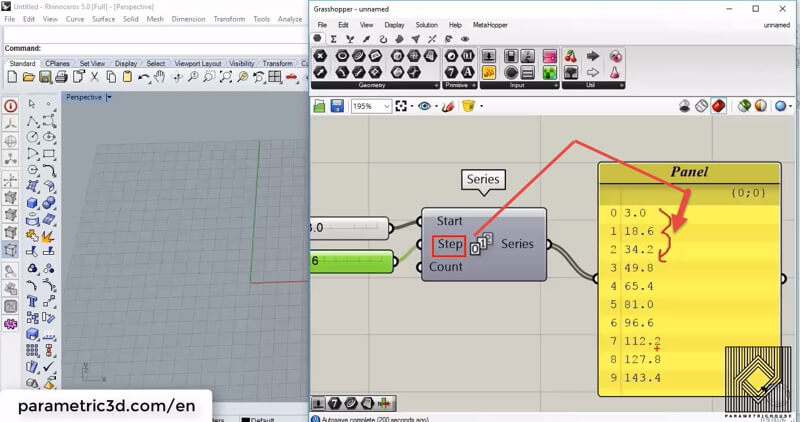
 Second is “Step” which tells how the numbers increase.
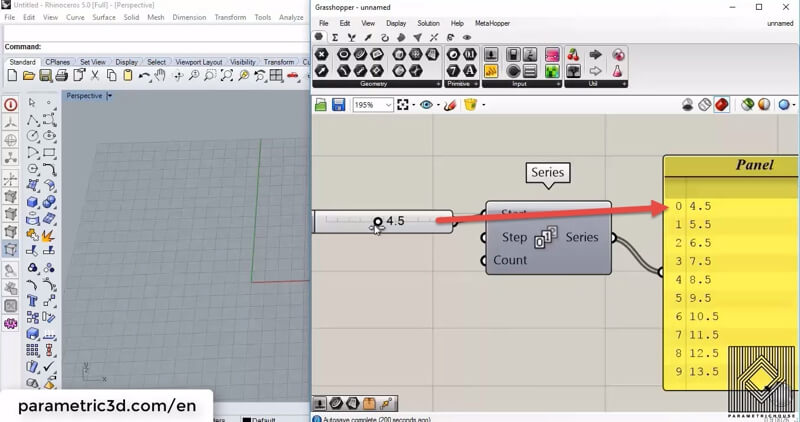
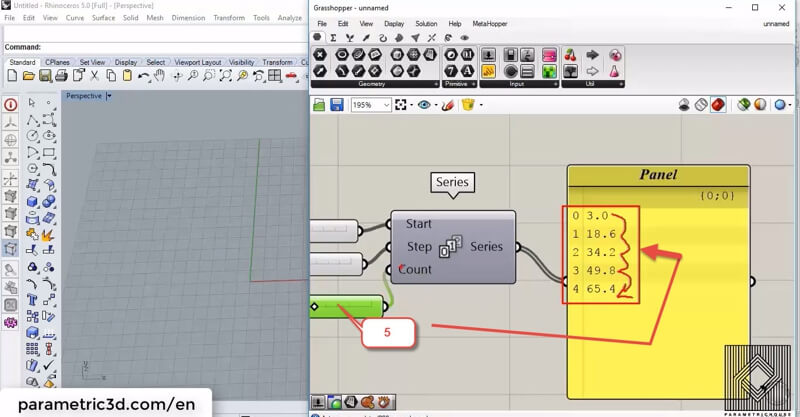
 The last input is “Count” which actually tells how many numbers are coming out the series. You can see the output by connecting a panel (Params>Input) to the output.
 The first example I,m going to show is using series to manage points. By connecting the series to the “x coordinate” of a “construct point” tool (Vector>Point) we can have a series of points. The number of points is determined by the count of the series
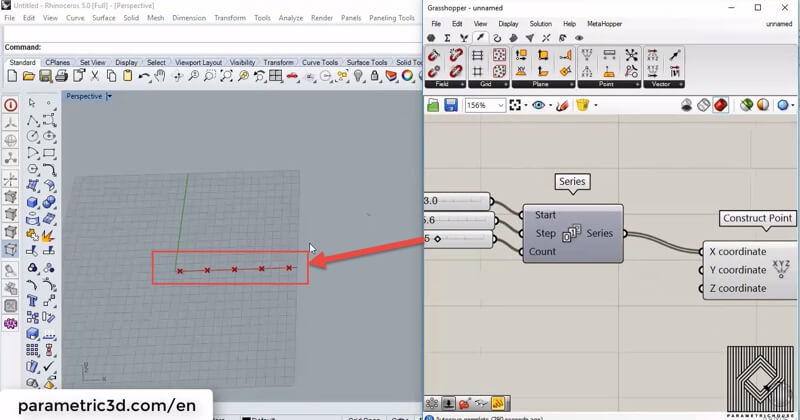 The “Start” will define the x coordinate of the first point in the series
 The Step of the series will define the distance between the points.
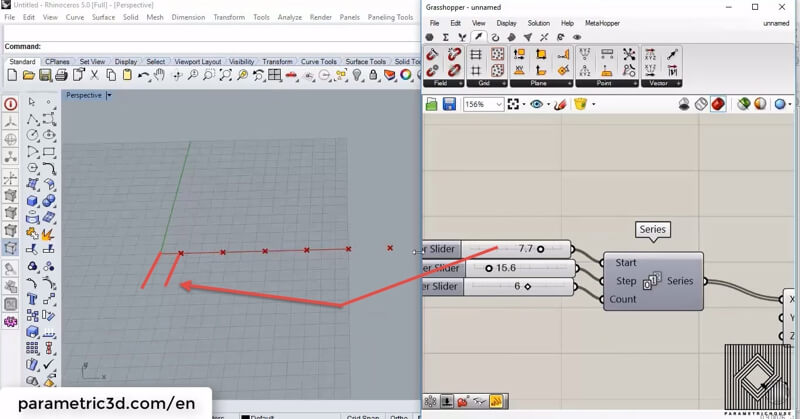
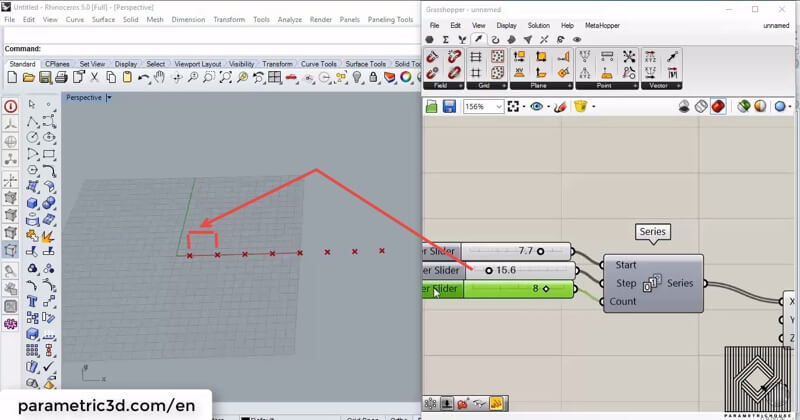 By connecting the series output to the x and y coordinate of the “construct point” we will have a series of points which their x andy coordinate are the same. This happens because Grasshopper will produce data based on corresponding data. this has been shown below.
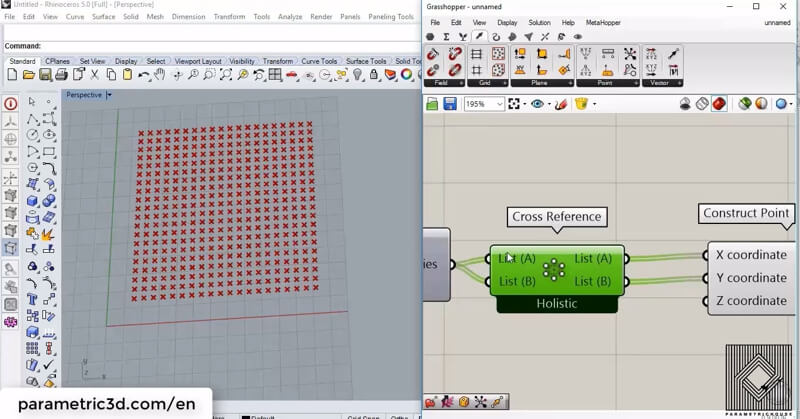
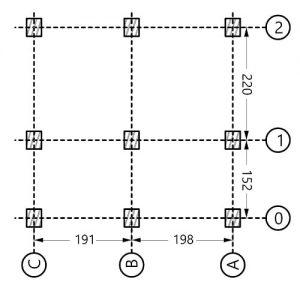
 To produce an array of points, we can use a tool called “Cross Reference” (Sets>List). The meaning of “Cross reference” before “construct point” is that we are telling Grasshopper 3d to combine each row of data with all the other rows. so if we have a series of numbers like :
0 : 10
1 : 20
3 : 30
and we “cross reference” the numbers, to the x and y coordinate of a point, we will have:
0 : (10,10)
1: (10,20)
2: (10 ,30)
3 : (20,10)
4: (20,20)
5 : (20,30)
6: (30,10)
7: (30,20)
8 : (30,30)
This is how we show all of the possible combinations of a series of numbers in a point and basically we get an array of points by that.
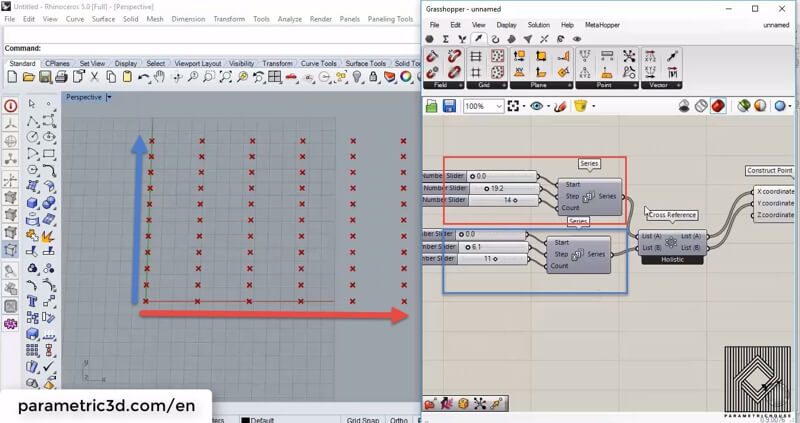
 By using two series of numbers you can control the array in both x and y direction.
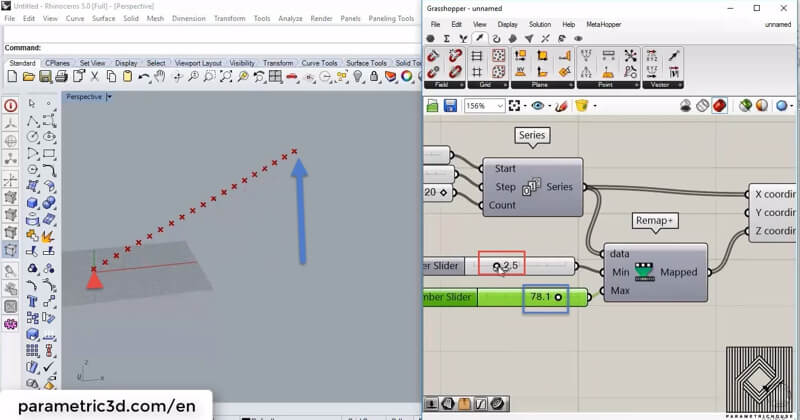
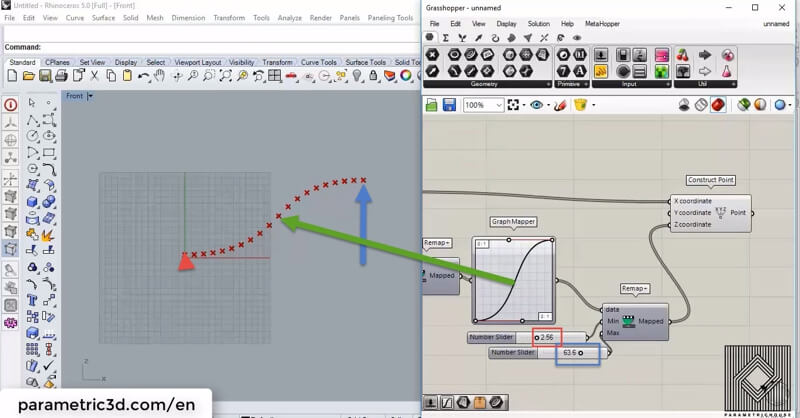
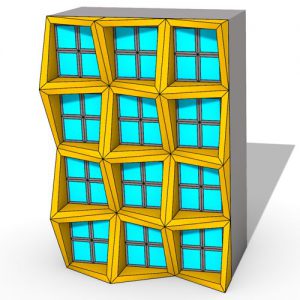
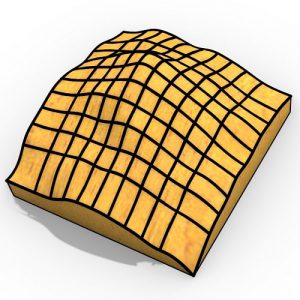
By using a new tool called “Remap+”, which I have made from “remap numbers”, “Bounds” and “construct domain”, you can control the minimum and maximum bounds of the series. You can download it HERE. If we remap the output of the series to the desired domain and connect it to the z coordinate of the point, we can control the heights.
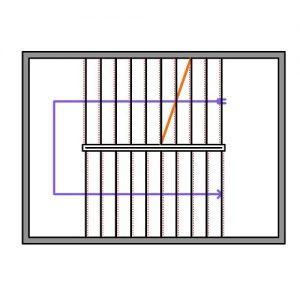
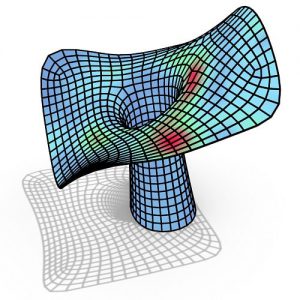
To get a more parametric output we can use another tool in a combination of Remap+. By giving the output to “Graph mapper” (Params>Input) we are actually changing the distribution of the numbers in the series. each number is projected from the x-axis to the graph and then projected to the y-axis to obtain a new number.
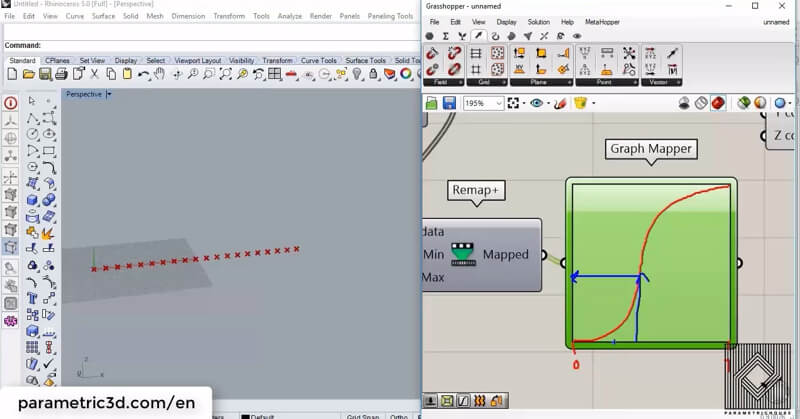
the distribution change of data is shown below.
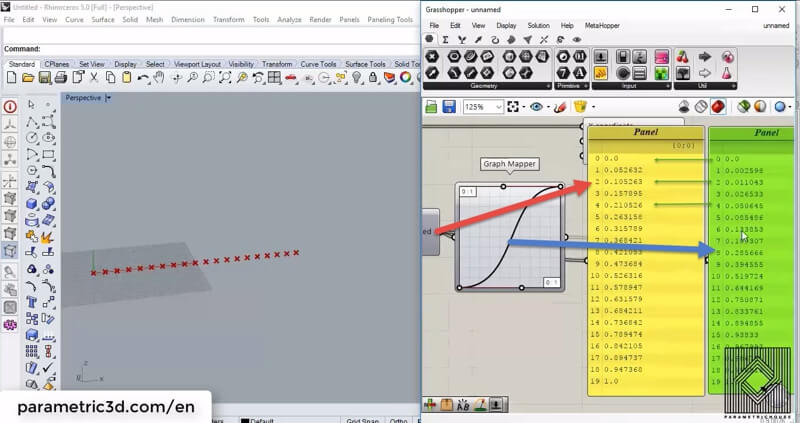
By using a beautiful technique, you can get the graph affect your data as desired. The first step is to remap your numbers to 0 and 1. Once they are in the “Graph mapper’s” default domain you can change the distribution by a graph mapper and then remap the numbers (or scale them!) back to the target domain.
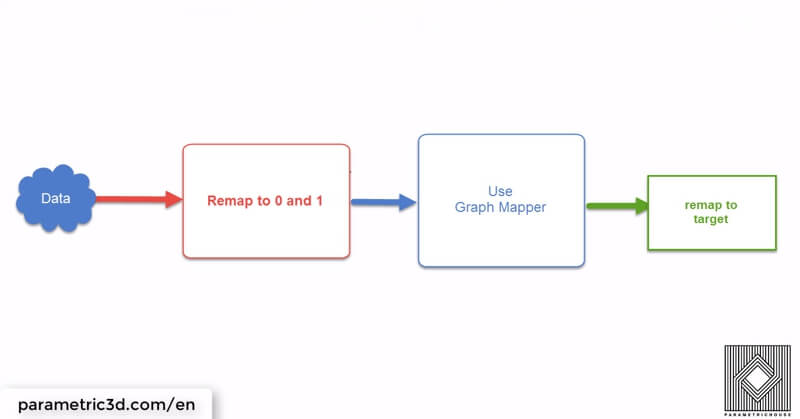
By using this technique we can make the points look similar to the graph and scale them to the minimum and maximum range desired.
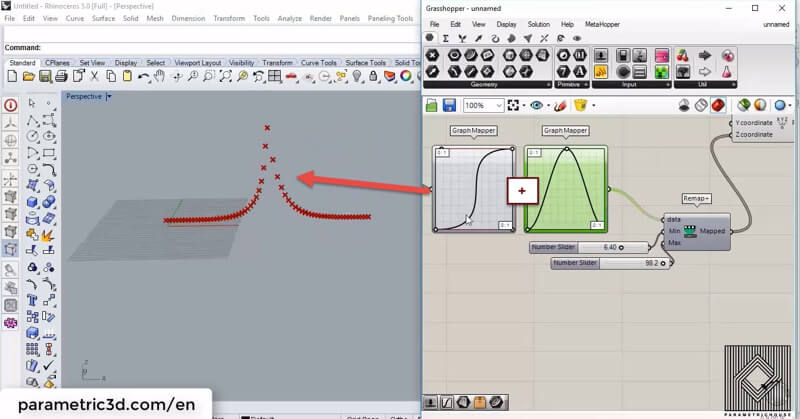
The good news is that you can combine as many “graph mapper”s as you want!
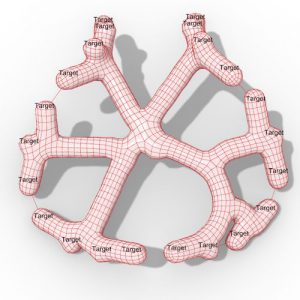
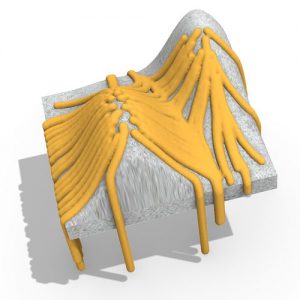
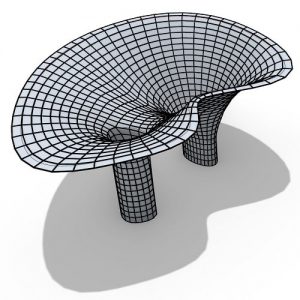
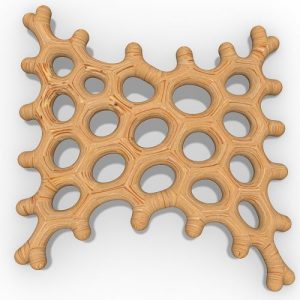
If we connect the points together by “Interpolate” (Curve>Spline) we can form a NURBS curve from the points. We can also connect a “Pipe”(Surface>Freeform) to the curve and make the results more visual.
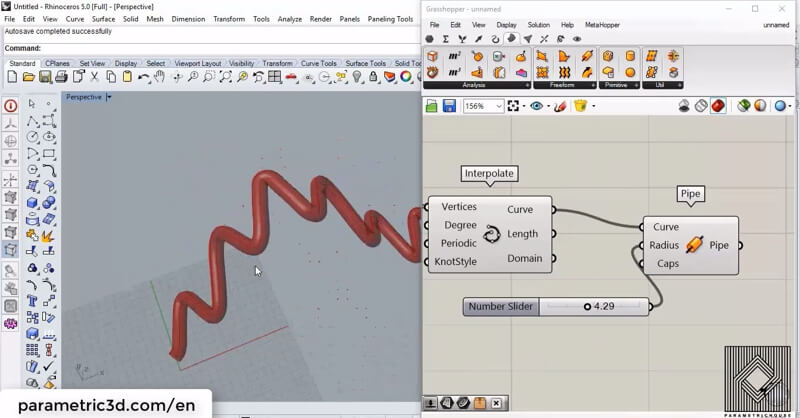
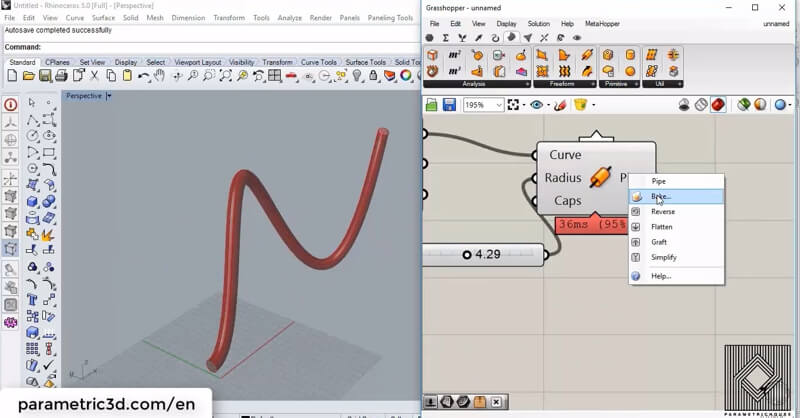
You can right click on the output (for example pipe or curve) and bake it so you can have more control on the geometry in Rhino.


Comments
Joshua D Plourde
Hi Where is the download link for the remap+ tool? The link here (By using a beautiful technique) just links back to this page.
parametric
Hi
You can always download it from the sidebar
https://dl.parametrichouse.com/remap.zip
Joshua D Plourde
Nevermind found it at the top!
cfeldman
Maybe there is a problem whit
Rhino 7 wip and Remap+?
–i cant work with that there–
Greetings
İREM
Unfortunately, remap+ doesn’t work 🙁
parametric
Try using this link
https://dl.parametrichouse.com/remap.zip
AdriAleksa
🙁 I couldnt use it either in Rhino7
Im just starting, wanted to make it as you said it could be done but I wasnt able .