
Visual Analytics
Visual analytics for generative design exploration:
An interactive 3D data envirionment for a computational design system facilitating the performance-driven design process of a nearly Zero-Energy sports hall
J. van Kastel, in partial fulfilment of the requirements for the degree of MsC Building Technology, Sustainable Design Graduation Studio at the Delft University of Technology
Improvement of design performances requires exploration of a larger amount of analyzed design solutions in the early design phase. Computational design systems use parametric modeling, building performance simulations and genetic algorithms to iterate through a large amount of design alternatives, converging towards optimal design solutions.
Computational design systems proposed by most existing researches do not enable interconnected analysis of quantitative and qualitative design performances, however, and consequently are rarely used in the field of architecture.
This thesis by J. van Kastel proposes a visual analytics system that visualizes design geometries and performances of a large data set of design alternatives in a highly interactive data environment. The visual analytics system is developed conjointly to the concept design of a nearly Zero-Energy sports hall. The sports hall is designed using a computational design system that generates a large set of design alternatives and analyzes energy performances, visual comfort performances and thermal comfort performances of each alternative.
This thesis develops a prototype of the visual analytics tool to visualize a data set of sports hall design alternatives. Peer review and user experience determine whether the tool as a whole and whether its data analytics methods suit the design-making process of practitioners in the field of architecture. The functionality of the computational design system is assessed by its suitability to facilitate a performance-driven design process.
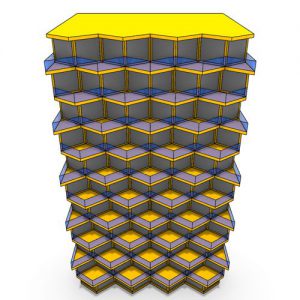
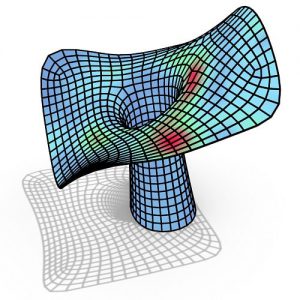
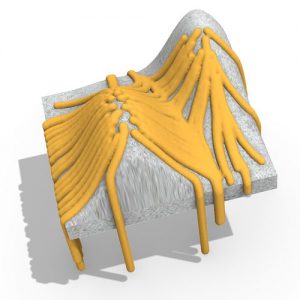
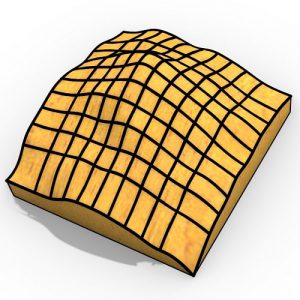
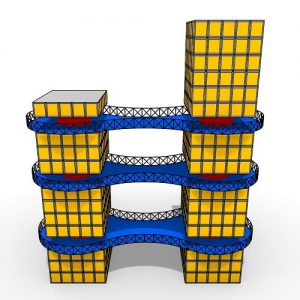
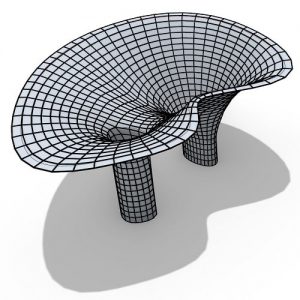
The computational design system proposed in this thesis uses multiple parametric models to create a varied set of design alternatives. The proposed visual analytics system is a game-like 3D environment. This environment integrates and displays a Self-Organizing map with other data analytics methods and all designs’ geometries in a single viewport. Multiple means of interaction facilitate deduction of qualitative and quantitative performances.
The visual analytics system is intuitive in use because of the use of metaphorical visualizations of data analytics methods. Peer review and testing of the visual analytics system indicate that the computational design system proposed in this thesis is generally able to improve design performances. The computational design system is effective in facilitating comparison of design alternatives and in use as a frame of reference throughout the design processes. Furthermore, the visual analytics system has potential in use for educative and documentation purposes.


Comments