String Art Generator
String Art Generator by Yiran is a grasshopper plugin which generates a string art sequence based on an input image. You can

A GAZE VISUALIZER TOOL IMPLEMENTATION OF GAZE DATA INTO LIGHTING RENDERING TOOLS USING RADIANCE AND HONEYBEE FOR GRASSHOPPER3D

The Gaze Visualizer tool is an implementation of eyetracking (gaze) data and a preliminary gaze responsive light driven (GRL) model, which enables to visualize gaze behavior in a 3D space, in Grasshopper3D. The workflow from obtaining the relevant photometric quantities, retrieving gaze data, intorduction of the GRL model to the tool and a simple data representation scheme are presented here.
The final plugin is easy to use for Rhino/Grasshopper developers with only basic skills, and provides a quick estimations of the gaze respionsive visual comfort in an illustrative way, that gives the user an adequate overview of the glare-free zones in the room.

Considering human needs in relation to indoor environment plays a crucial role in buildings’ overall performance. A basic human need is a comfortable indoor environment (Monika Frontczak and Wargocki 2011) such as visual comfort with mainly psychological aspects (Bollen 2002; M. Frontczak et al. 2012). However, investigations on human body responses to indoor conditions proves to be essential (Bluyssen 2013) for better understanding of human needs.
Gaze is a volitional or reflexive body response where we direct our line of sight as a visual response to the surrounding conditions. Eye-movement classes such as saccades (rapid shifts) and fixations (longer pauses) coexist with head and body movement to shift our gaze. The full contribution of these effectors (eye, head, body) to gaze (’t Hart and Einhäuser 2009) provides information on visual response to the surrounding visual environment during a real-life task (’t Hart and Einhäuser 2012; Fairchild et al. 2001) such as working in an office.

A 3Dimentional geometrical model to be used with the developed tool can be set up in Rhinoserous 3D modeling tool. Each surface of the 3D model is defined in Grasshopper with the createHBsurf component, which allows setting up different reflection properties for walls, ceilings and floors of the 3D model. The window glasses are defined with a transmittance factor.
Moreover, locations with an associated weather file and orientation of the model are needed in order to perform an imagebased simulation. Finally, a specific day, hour and sky condition needs to be defined. The vp in the 3D model can be set using the point tool at a desired place to define where the occupant’s eye is located.

In order to run daylight simulations for all gaze directions and create the needed HDR images, all the surfaces in the 3D model must be assigned a Radiance material. These materials determine how the light will interact with the surfaces in the zone. It is possible to use four classes of Radiance materials, plastic, metal, trans or mirror, which can be assigned to the 3D model using the Honeybee.

The relevant photometric values as input to GRL model are derived from HDR images with angular fisheye projection rendered by using advanced physically based light renderings tools such as Radiance (Ward-Larson and Shakespeare 1998). These images can then be processed using Radiance -based tools Findglare (Ward 1992) or Evalglare (Wienold and Christoffersen 2006).
Here, the HDR images were obtained using Honeybee plugin, which is connected to Radiance. To use Evalglare directly from Grasshopper a component has been made called RunEvalglare, which runs Evalglare and adds the obtained photometric values to a list for each rendered HDR image. The needed input to this component is the working directory, gaze directions and a path to the rendered images.

In this paper, we briefly describe the implementation of Gaze data and GR L model into Grasshopper as a tool with mention of several components and the main principles that have been created and used for each step of the working process of the new Gaze Visualizer tool development. The developed tool shows the shifted gaze for one viewpoint in a 360◦ view range and highlights the gaze responsive glare-free zones in the space.
mentioned here, which will be further developed in future steps. The current result shows the gaze responsive zones from only one vp. An extension of this feature to a grid of points where the frequency for the shifted gaze could be illustrated with a color map in Rhino is foreseen in future development of the tool.

Several additional features such as a legend describing the data and final visualized images with the intersection gaze data needs further development. Finally, a general limitation is the rendering time and running the subprocesses. In a design process, simulation tools need to be quick in order to iterate over multiple design options.
A GAZE VISUALIZER TOOL IMPLEMENTATION OF GAZE DATA INTO LIGHTING RENDERING TOOLS USING RADIANCE AND HONEYBEE FOR GRASSHOPPER3D
Mandana Sarey Khanie1, Susanne V. Kjærgaard1, Mia H. K. Johnsen1, Kristoffer Negendahl1, Jan Wienold2, Maryline Andersen2
1 Department of civil engineering, Technical University of Denmark (DTU), Denmark 2 Laboratory of Integrated Performance in Design (LIPID), École Polytechnique Fédérale de Lausanne (EPFL), Switzerland

The Gaze Visualizer tool is an implementation of eyetracking (gaze) data and a preliminary gaze responsive light driven (GRL) model, which enables to visualize gaze behavior in a 3D space, in Grasshopper3D. The workflow from obtaining the relevant photometric quantities, retrieving gaze data, intorduction of the GRL model to the tool and a simple data representation scheme are presented here.
The final plugin is easy to use for Rhino/Grasshopper developers with only basic skills, and provides a quick estimations of the gaze respionsive visual comfort in an illustrative way, that gives the user an adequate overview of the glare-free zones in the room.

Considering human needs in relation to indoor environment plays a crucial role in buildings’ overall performance. A basic human need is a comfortable indoor environment (Monika Frontczak and Wargocki 2011) such as visual comfort with mainly psychological aspects (Bollen 2002; M. Frontczak et al. 2012). However, investigations on human body responses to indoor conditions proves to be essential (Bluyssen 2013) for better understanding of human needs.
Gaze is a volitional or reflexive body response where we direct our line of sight as a visual response to the surrounding conditions. Eye-movement classes such as saccades (rapid shifts) and fixations (longer pauses) coexist with head and body movement to shift our gaze. The full contribution of these effectors (eye, head, body) to gaze (’t Hart and Einhäuser 2009) provides information on visual response to the surrounding visual environment during a real-life task (’t Hart and Einhäuser 2012; Fairchild et al. 2001) such as working in an office.

A 3Dimentional geometrical model to be used with the developed tool can be set up in Rhinoserous 3D modeling tool. Each surface of the 3D model is defined in Grasshopper with the createHBsurf component, which allows setting up different reflection properties for walls, ceilings and floors of the 3D model. The window glasses are defined with a transmittance factor.
Moreover, locations with an associated weather file and orientation of the model are needed in order to perform an imagebased simulation. Finally, a specific day, hour and sky condition needs to be defined. The vp in the 3D model can be set using the point tool at a desired place to define where the occupant’s eye is located.

In order to run daylight simulations for all gaze directions and create the needed HDR images, all the surfaces in the 3D model must be assigned a Radiance material. These materials determine how the light will interact with the surfaces in the zone. It is possible to use four classes of Radiance materials, plastic, metal, trans or mirror, which can be assigned to the 3D model using the Honeybee.

The relevant photometric values as input to GRL model are derived from HDR images with angular fisheye projection rendered by using advanced physically based light renderings tools such as Radiance (Ward-Larson and Shakespeare 1998). These images can then be processed using Radiance -based tools Findglare (Ward 1992) or Evalglare (Wienold and Christoffersen 2006).
Here, the HDR images were obtained using Honeybee plugin, which is connected to Radiance. To use Evalglare directly from Grasshopper a component has been made called RunEvalglare, which runs Evalglare and adds the obtained photometric values to a list for each rendered HDR image. The needed input to this component is the working directory, gaze directions and a path to the rendered images.

In this paper, we briefly describe the implementation of Gaze data and GR L model into Grasshopper as a tool with mention of several components and the main principles that have been created and used for each step of the working process of the new Gaze Visualizer tool development. The developed tool shows the shifted gaze for one viewpoint in a 360◦ view range and highlights the gaze responsive glare-free zones in the space.
mentioned here, which will be further developed in future steps. The current result shows the gaze responsive zones from only one vp. An extension of this feature to a grid of points where the frequency for the shifted gaze could be illustrated with a color map in Rhino is foreseen in future development of the tool.

Several additional features such as a legend describing the data and final visualized images with the intersection gaze data needs further development. Finally, a general limitation is the rendering time and running the subprocesses. In a design process, simulation tools need to be quick in order to iterate over multiple design options.
String Art Generator by Yiran is a grasshopper plugin which generates a string art sequence based on an input image. You can

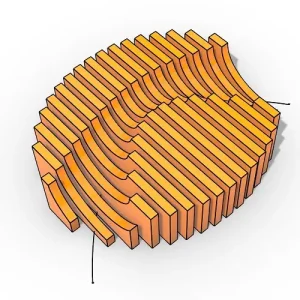
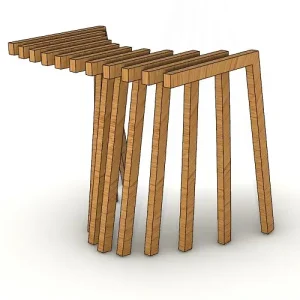
This paper by Alessandro Liuti, Sofia Colabella, and Alberto Pugnale, presents the construction of Airshell, a small timber gridshell prototype erected by employing a pneumatic formwork.

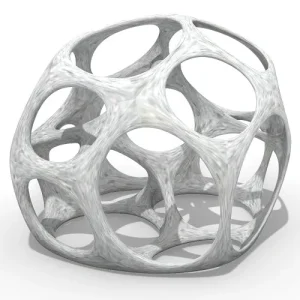
In this paper by Gregory Charles Quinn, Chris J K Williams, and Christoph Gengnagel, a detailed comparison is carried out between established as well as novel erection methods for strained grid shells by means of FE simulations and a 3D-scanned scaled physical model in order to evaluate key performance criteria such as bending stresses during erection and the distance between shell nodes and their spatial target geometry.

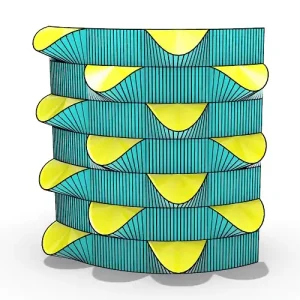
In this paper by Frederic Tayeb, Olivier Baverel, Jean-François Caron, Lionel du Peloux, ductility aspects of a light-weight composite gridshell are developed.