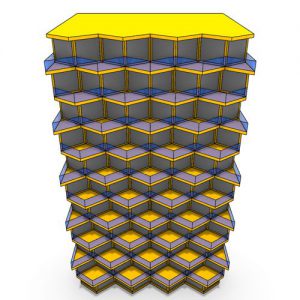
1- Structural Shell
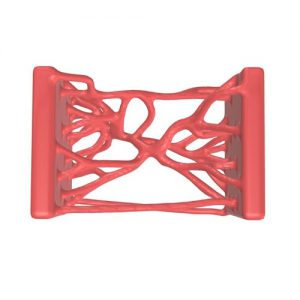
In this Grasshopper tutorial, I will model a parametric surface and then use the millipede plugin to optimize the structure based on maximum displacement.

In this Grasshopper tutorial, I will model a parametric surface and then use the millipede plugin to optimize the structure based on maximum displacement.
In this Grasshopper tutorial for beginners, you'll discover how to relax a mesh over a series of lofted solids to construct a parametric roof.
In this Rhino Grasshopper tutorial for beginners, you will learn how to model a recursive splitting algorithm inside any closed boundary using the Anemone plugin.
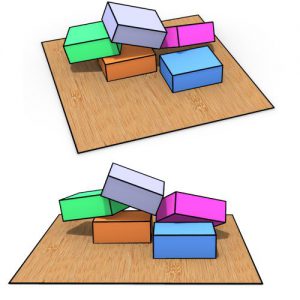
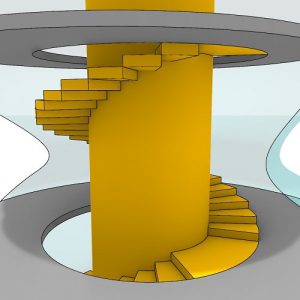
In this Grasshopper tutorial, you'll learn how to use the Rigid Body Goal to simulate collisions between solids and bring them down along a specified plane.
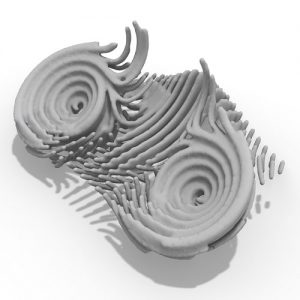
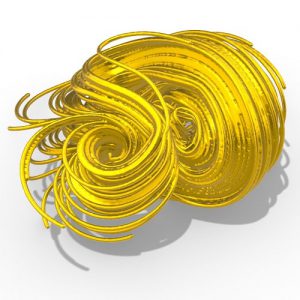
In this Grasshopper tutorial, you can generate a series of mirrored spin forces and then convert them into a mesh using the Dendro plugin.
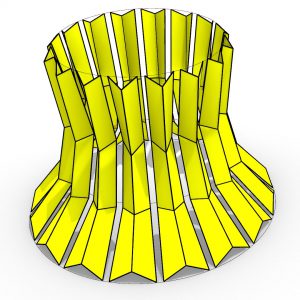
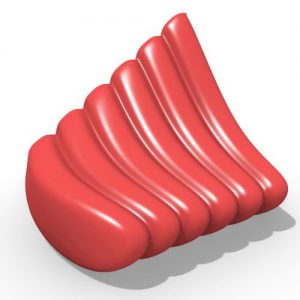
In this Grasshopper example file, you can use a series of curves to design a parametric shade or generate a collection of controllable strips.
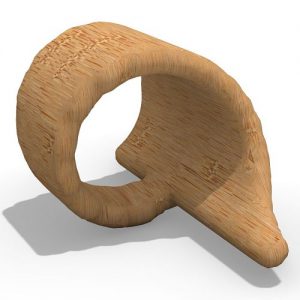
In this Grasshopper example file, you can design a parametric ring based on a 3D wave pattern using the Dendro plugin.
In this Grasshopper tutorial, you can generate a series of random spin forces and then convert them into a mesh using the Dendro plugin.
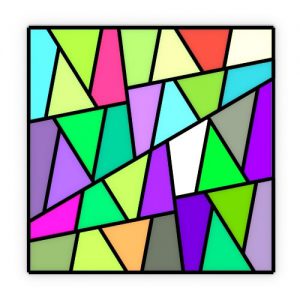
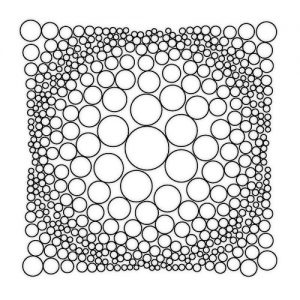
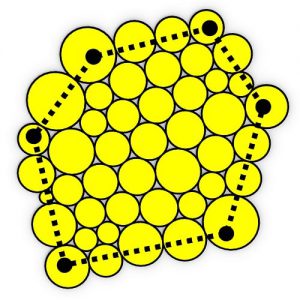
In this Grasshopper example file, you can convert any image to a circle pack output. Additionally, you can convert the circles into a triangular mesh.
In this Grasshopper Dendro example file, you can use the Trap Field component from the Heteroptera plugin to generate a series of random connecting curves between two faces.
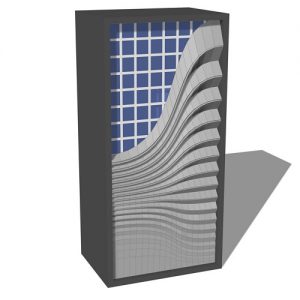
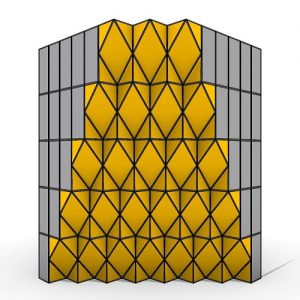
In this Grasshopper example file, you can design a parametric tower by defining a series of curves to control the facade.
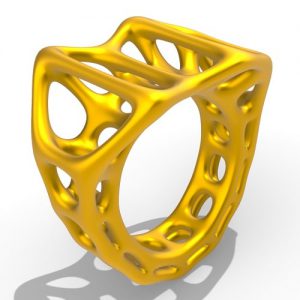
In this Grasshopper tutorial for beginners, you can learn how to model a parametric box ring from scratch without using any plugins.
In this Grasshopper example file you can connect two SubD surfaces using a series of lines and then convert the top to a multipipe structure.
In this Grasshopper Kangaroo example file you can design a parametric earring using the circle packing technique.
In this Grasshopper example file you can design a parametric Louver facade using the Pufferfish Plugin.
In this Grasshopper example file you can design a parametric building using the native grasshopper components.
In this Grasshopper example file you can design a parametric facade using the native components.
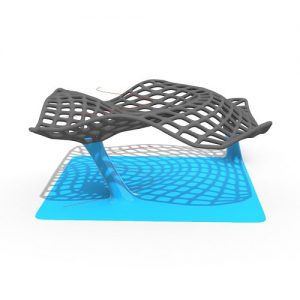
In this Grasshopper Dendro tutorial, you can learn how to create a growing mesh by defining a series of spin fields on a NURBS surface using the Heteroptera plugin.
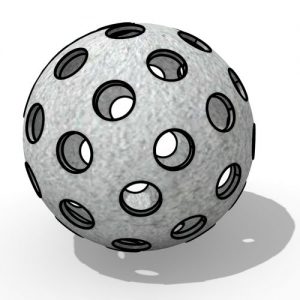
In this Grasshopper Tutorial for beginners you will learn how to use the Sphere collide component to generate evenly distributed holes on a NURBS surface.
In this Grasshopper Kangaroo example file, you can circle pack a mesh using the "TangentIncircles" component.
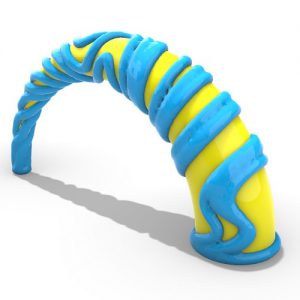
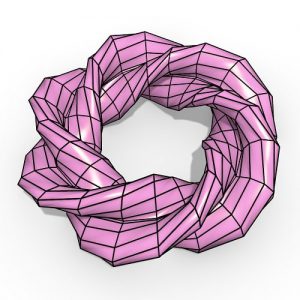
In this Grasshopper example file, you can utilize the Nautilus plugin to design a parametric Twisted Torus.
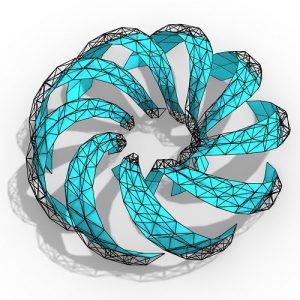
In this Grasshopper example file, you can model twisted torus strips and convert them into a spaceframe and panels using the Lunchbox Plugin.
In this Grasshopper example file, you can convert a series of curves into a mesh with a 3d groove pattern using the Nautilus and Weaverbird plugins.
In this Grasshopper tutorial, you will learn how to model a parametric joint on the corners of a box with controllable parameters.
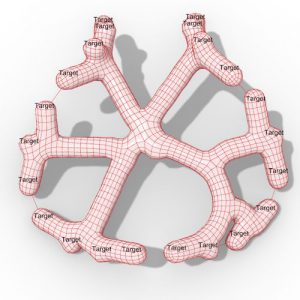
In this Grasshopper example file, you can simulate an optimized path from an origin point/points toward a set of targets. The strategy involves branching at diverging points.


Comments
albaalba
Attachment InkedViewCapture20240301_202942_LI.jpg
I watched your video about Galapagos optimization and implemented your definition into my project. However, I have some questions about data recording and visualization. My project’s genomes consist of my shell geometry cross-section and arch height values. The fitness function is the displacement value. As in your video, I used data recorders and text tags to visualize my results. I want to visualize all the optimized geometries in grid order on the Rhino screen. I also want to show optimized cross-section and arch height values of the geometries in the Rhino viewport. If it is possible, I need your aid. The document submission button doesn’t allow me to upload my rar. document. If you share with me an e-mail address, I can share my documents with you. Thanks in advance.
parametric
Attachment idea.zip
Hi. You can use this file to get an idea of how