
Parametric Urban Patterns
Parametric Urban Patterns
Martin Bielik1, Sven Schneider2 and Reinhard König3
Bauhaus-University Weimar, Germany
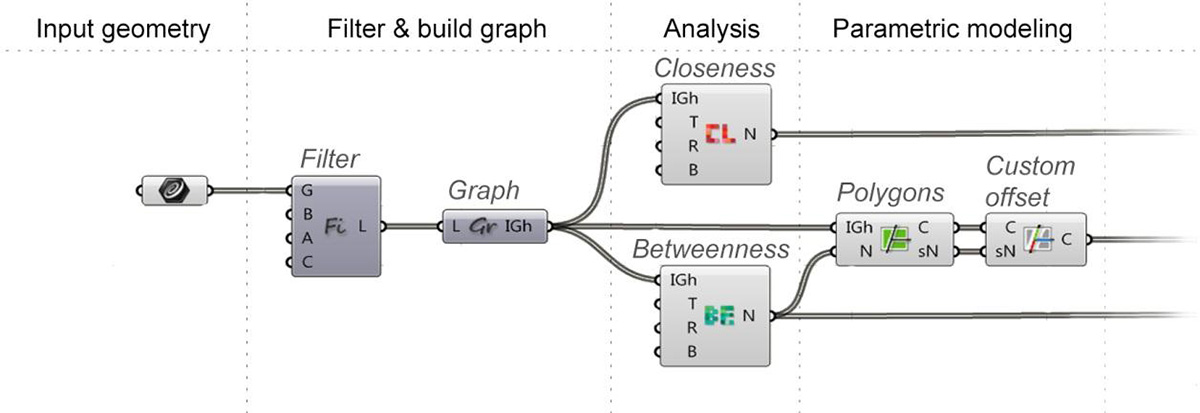
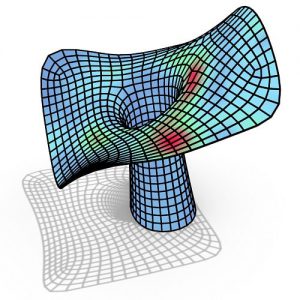
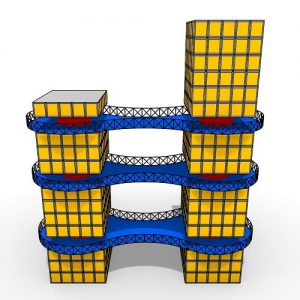
Figure 1 Modular concept of the spatial analysis framework for Grasshopper
The article presents a graph-based spatial analysis toolset (“decoding spaces” components) which we have recently developed as an extension of the visual scripting language Grasshopper3D for Rhino. These tools directly integrate spatial analysis methods into CAD design software which can have a significant effect on current design workflows.
However, grasshopper doesn’t only enable the results of analyses to be used in the standard Rhino modelling environment. It also makes it possible to integrate spatial analysis into a parametric design approach as discussed in this paper. The functionality of this toolset is demonstrated using a simple urban design scenario where we introduce the idea of parametric patterns based on graph-measures.
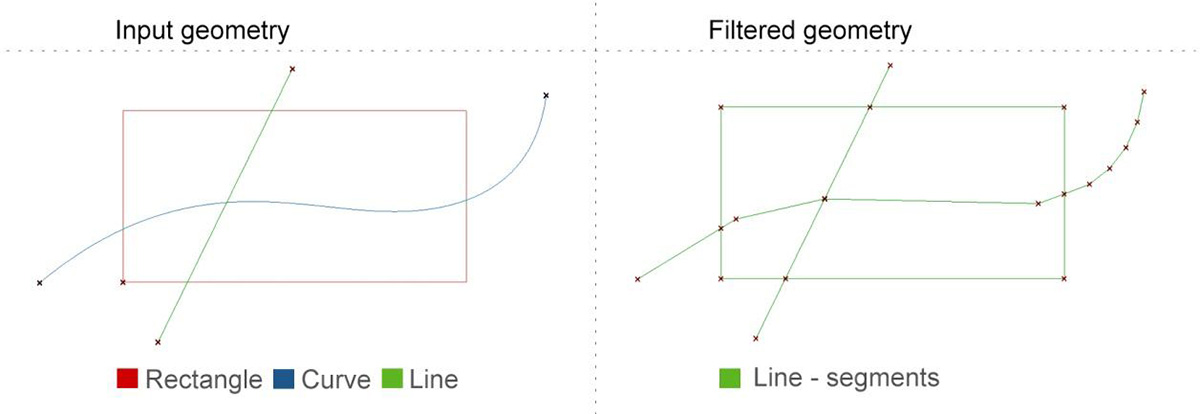
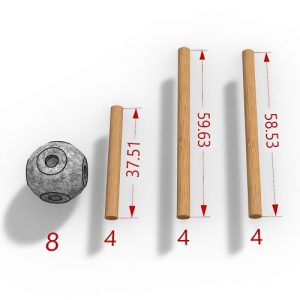
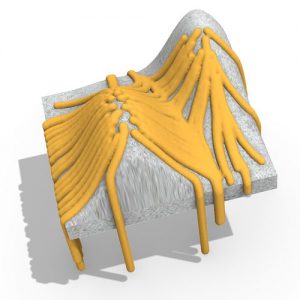
Figure 2 Filter Component converting geometry into line segments
Graph based spatial analysis is a method which was first introduced in architecture and urban planning by Bill Hillier and his colleagues in the late 1970s as Space Syntax theory (Hillier & Hanson 1984). Because tests have shown that there are correlations between graph-based measures and functional aspects of a spatial configuration, the method has the potential to help architects in forecasting the socio-economic effects of their designs.
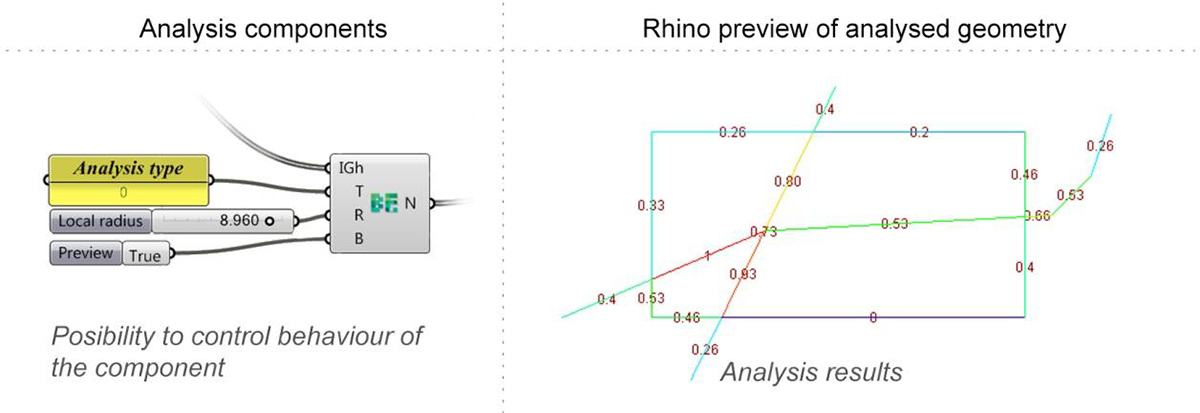
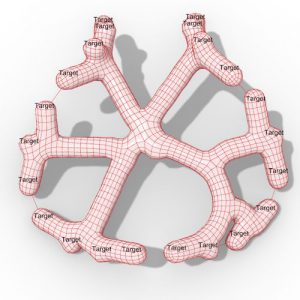
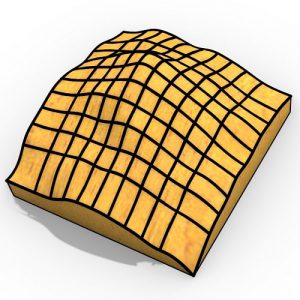
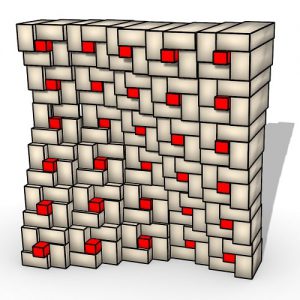
Figure 3 Analysis Component and its Rhino display
The core principle of the methodology is to represent space (e.g. an urban or floor plan) as a configuration of single elements (e.g. streets, rooms) and to analyse their mutual relations. Three different representations are used to analyse space in terms of its basic elements: isovists, convex spaces and axial lines. For the software concept described below, we are particularly interested in the latter.
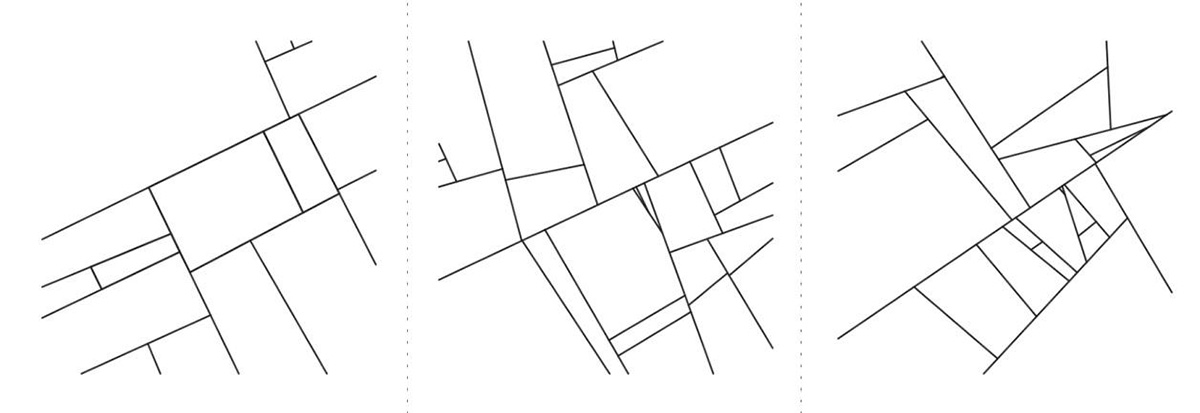
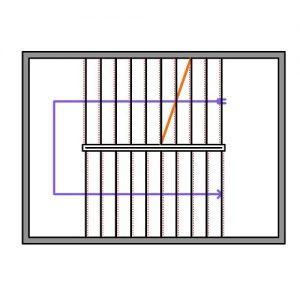
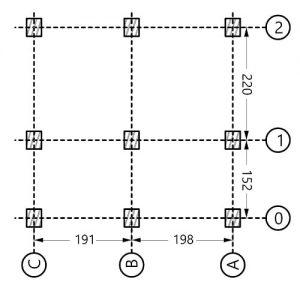
Figure 4 Fictitious urban district
An axial line is basically a line of sight in an environment. Based on the assumption that people use lines as a mental concept to orient and move through cities, axial maps represent a model of urban space as essentially a network of linear spaces. An axial map is a set of axial lines which cover the open space of a city completely. This map can be analysed using graph-based methods. For this the map needs to be converted into a graph.
The lines represent the nodes, while the interconnections between the lines represent the edges of a graph. There are two important measures which can be calculated based on this graph: between-ness, closeness and connectivity. Closeness (or integration) measures the average distance from one element to all other elements (global integration) or to elements within a certain radius (local integration).
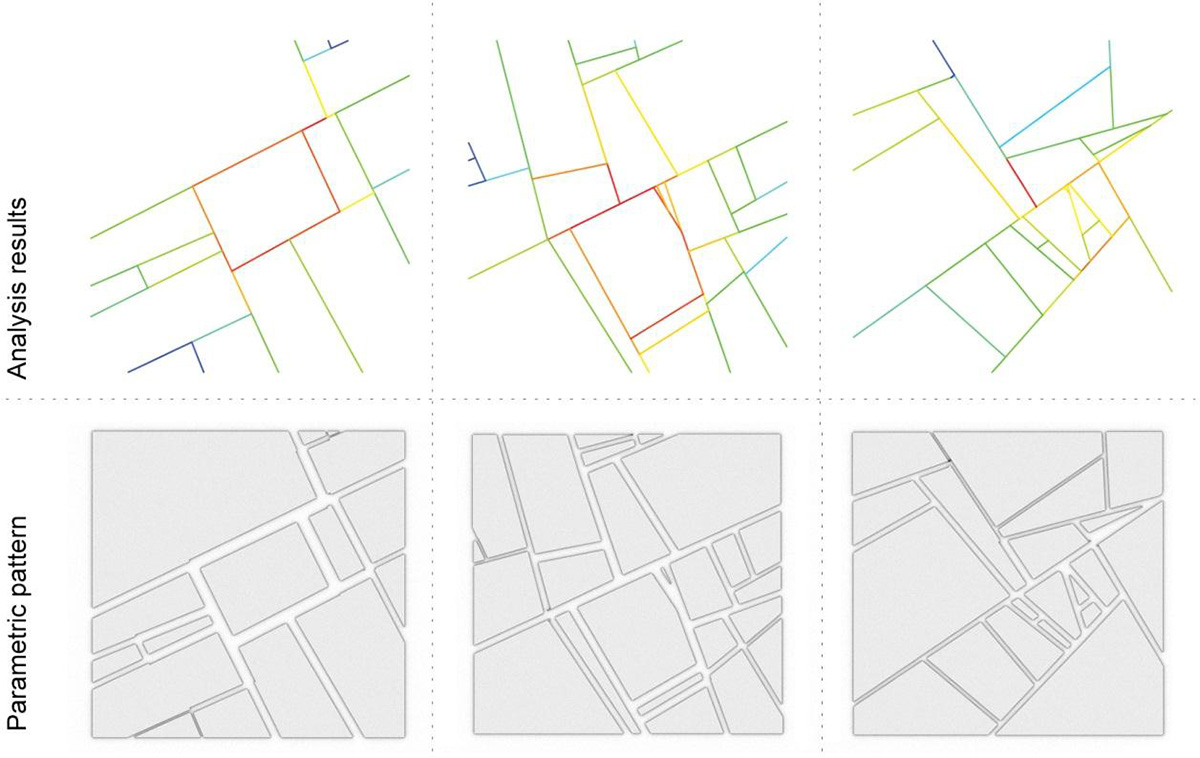
Figure 5 Street width generated using closeness analysis
The distance calculation is undertaken by counting the steps necessary to move from one element to another. The measure indicates, globally or locally, the topological centre of a city, i.e. the part or parts of a city where most people reside and where the highest density of buildings with retail functions is to be found. Betweenness (or choice) measures how often an element is passed if all the shortest paths in the graph (of each element to all other elements) are traversed.
The elements with the highest closeness value are more frequently passed. The concept of axial maps was later extended by another linear spatial representation, so called segment maps (Hillier & Iida, 2005). This is also based on the line network, but its basic element is a line segment. A segment occurs between the intersections of axial lines.
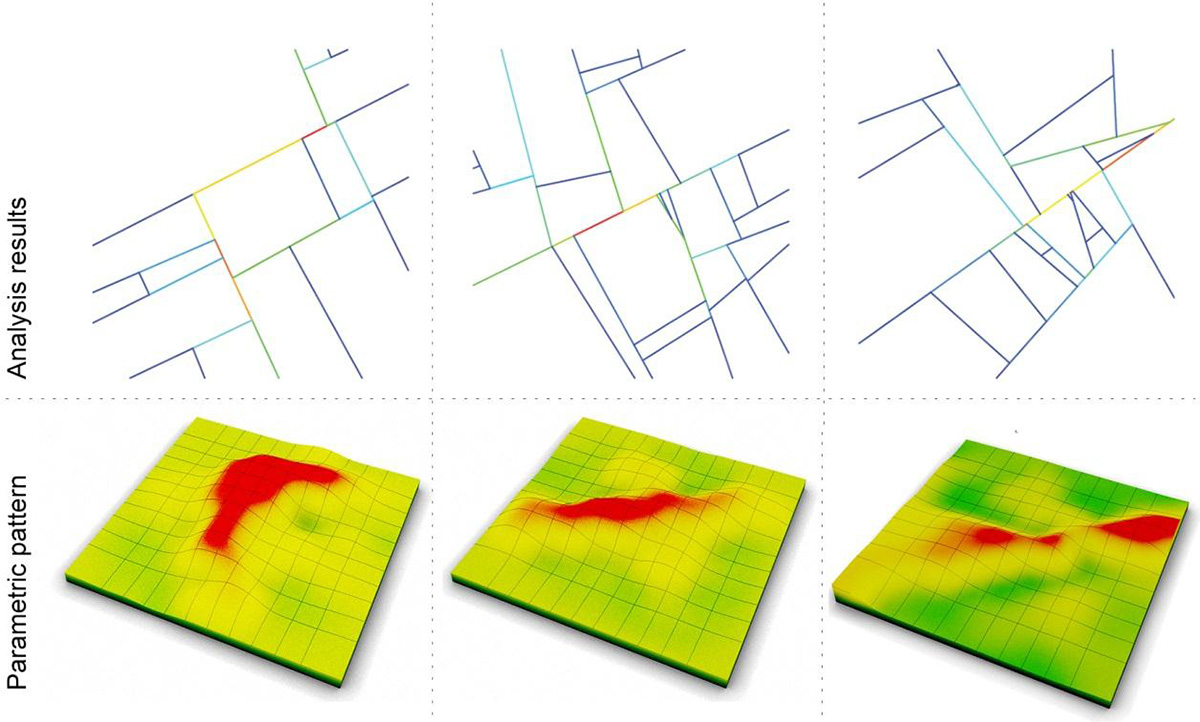
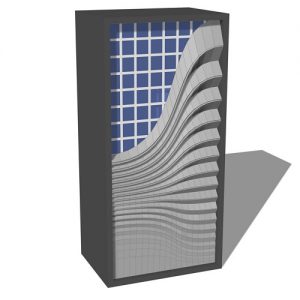
Figure 6 Massing model generated using Closeness analysis
For calculating the distance between two segments, not the number of segments, but the angle between the segments is taken into account. Compared with axial maps, segment maps offer two advantages: firstly, by using angles instead of steps the analysis results correlate more strongly with movement patterns; and secondly, since the method uses smaller element it offers a much finer scale of configurational analysis.
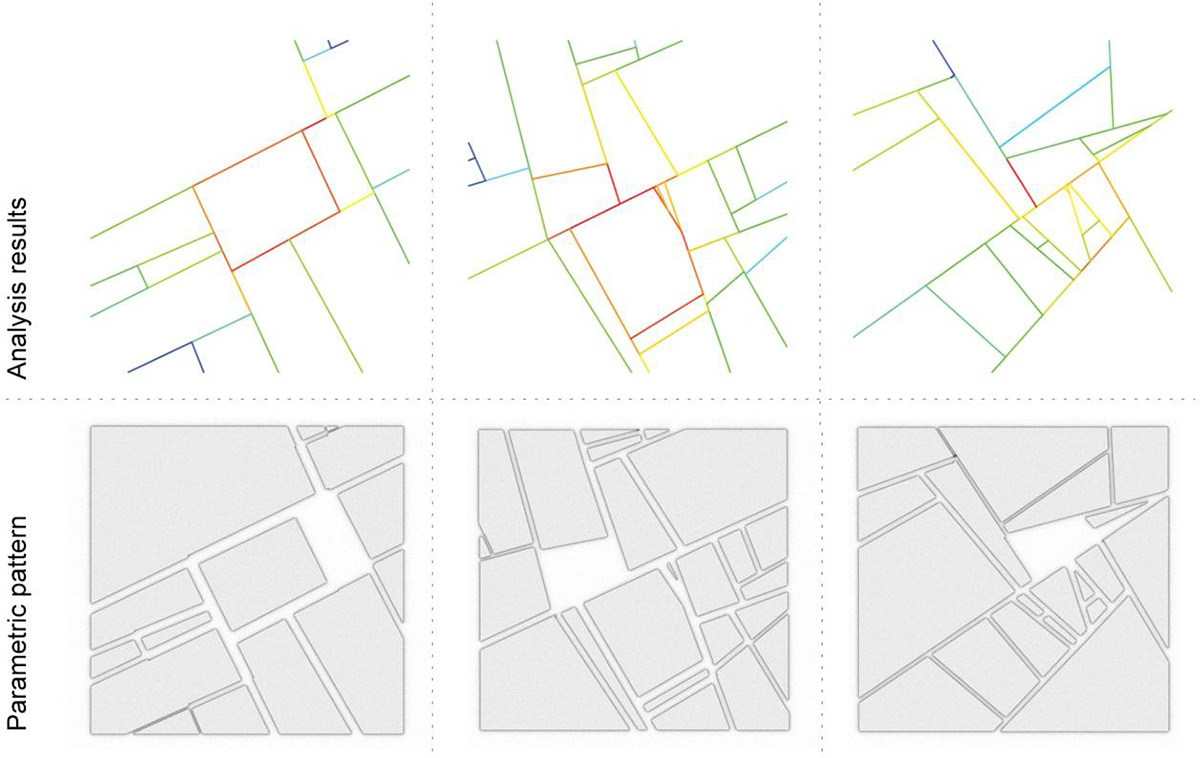
Figure 7 Choosing where public spaces should be
Since the analysis methods above focus solely on the geometrical arrangement of spatial elements and require no additional data on land use or traffic for their calculations, they are particularly suitable for examining design alternatives in terms of their spatial characteristics. There are several software packages available to run such analyses, but creating and changing the geometry has to be done with specialised CAD software.
Since the design process is an ongoing iterative process of improvement based on the creation of ideas and their evaluation (Lawson, 2006), it is beneficial for the design to explore as many iterations as possible in the design process. With the conventional workflow and file formats, this is problematic: each iteration requires that the user exports and imports date back and forth between the design and analysis tools. This hinders the design workflow significantly and acts as a disincentive for the designer to explore a wide range of variants.
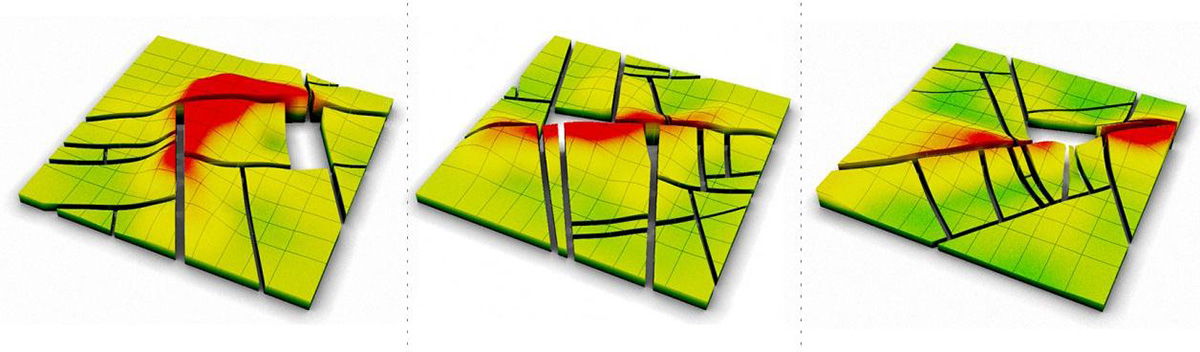
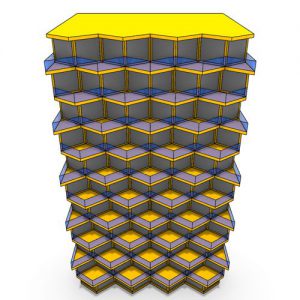
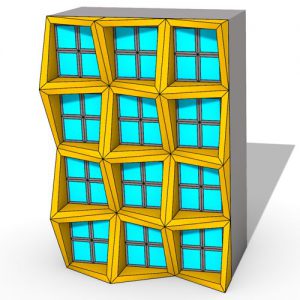
Figure 8 All patterns combined together
In this article software components have been presented that make it easy to couple parametrical models with graph-based spatial analysis (closeness, between-ness). This offers two main advantages: firstly, the analysis can be run directly in a CAD environment (using Rhino as a geometric modeller), which makes removes hurdles in the design workflow; and secondly, the results of the analysis can be used directly as parameters for the parametric model.
This opens up new ways of thinking about how one can incorporate spatial analysis into the creation of forms. One possible way was outlined by introducing the concept of parametric urban patterns. The algorithmic structure of these patterns makes it possible to apply computational technologies to design tasks. The use of computational methods represents a significant enhancement in response time between the choice of a pattern and its application, and this is one of the greatest advantages of this new interpretation of design patterns.


Comments